When Your Route Starts Learning: How Digital Twins Are Changing Voyage Planning
Why the future of routing is ship‑specific, data‑driven, and a lot closer to your helm than you think

You may know that moment offshore when the forecast and the sea state quietly part ways. The plotter still shows your pre‑planned route arcing confidently across the chart, but the wind has backed a little more than expected, the swell is steeper on the bow, and the boat just feels different than the line you drew in the comfort of port.
For decades, commercial captains have lived in that tension: the route on paper, and the reality under the keel. Traditional voyage plans are carefully built, but they’re still fundamentally static—based on generic ship tables, coarse‑grid forecasts, and a lot of human judgment layered on top.
Now a new layer is coming into focus: AI‑driven routing systems built on digital twins of individual vessels. These twins don’t just know “a Panamax bulker” or “a 60‑meter yacht”—they learn your hull, your engines, your fouling, and how your ship actually behaves in real seas.
In this article, we’ll do three things:
Walk through (conceptually) how most route planning still works today, without digital twins
Explore what a vessel digital twin really is and how it’s built
Compare a “normal” route to one guided by AI on top of a digital twin—and what that shift means for the contract of trust between the numbers on your screen and the water under your keel
How voyage planning works without a digital twin
If you strip away the acronyms and software, voyage planning in deep‑sea shipping still follows a familiar four‑stage pattern: appraisal, planning, execution, and monitoring1.
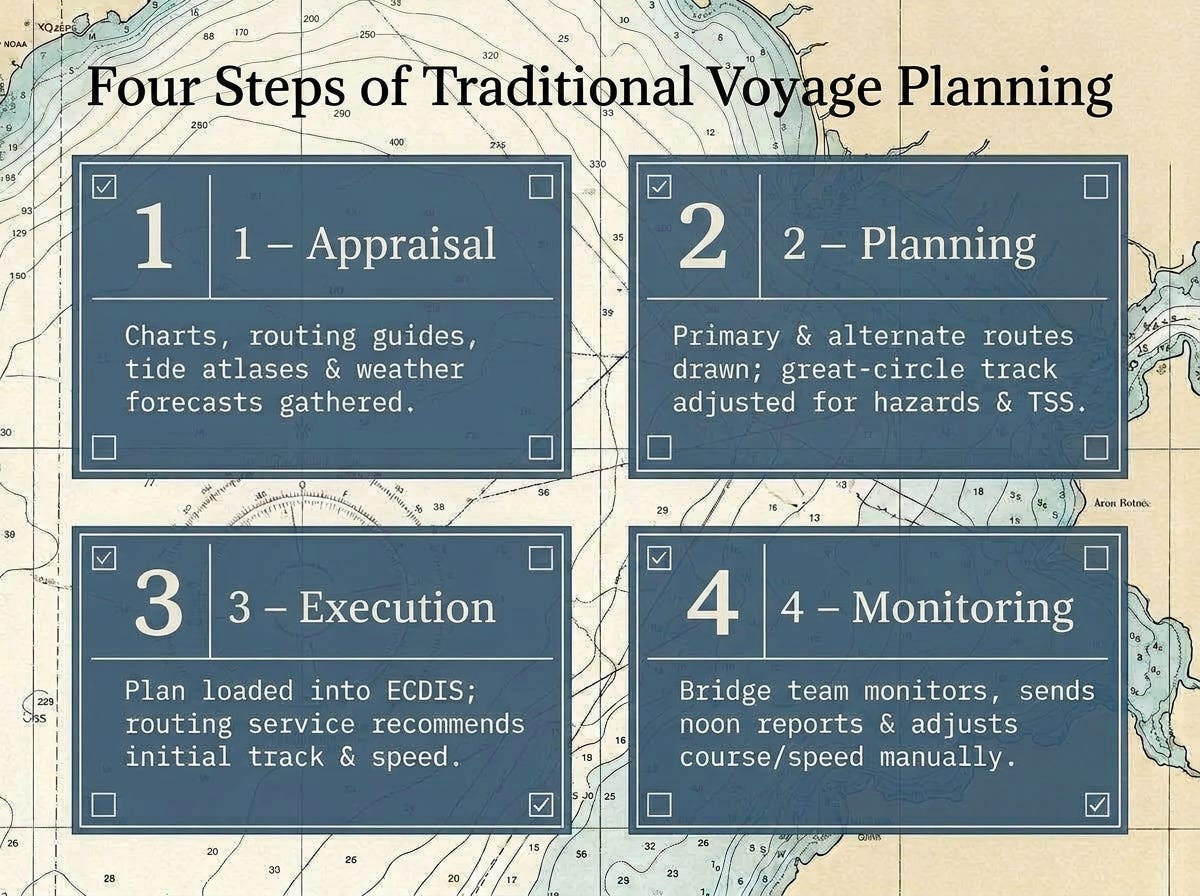
Step 1: Appraisal: assembling the big picture
Before a long passage, the bridge team gathers – or you as the captain of a delivery or private yacht:
Charts and ENC coverage
Sailing Directions and routing guides (like Ocean Passages for the World)
Tide and current atlases
Notice to Mariners updates and nav warnings
Seasonal weather and wave climatology
Any company routing instructions or charter‑party constraints
The goal is to understand the ocean “chessboard” for this passage: likely storm tracks, ice or piracy risk areas, traffic schemes, drafts and air‑draft constraints, and port limitations.
Step 2: Planning: drawing the line
Next comes the actual route:
A primary route—often great‑circle or composite—connecting departure and arrival, adjusted around known hazards and separation schemes.
One or more alternative routes to account for seasonal weather or security concerns.
A notional speed profile based on timetable and generic speed–power curves from trials or manuals.
Some operators and captains subscribe to traditional weather‑routing services: ashore, a routing team uses global forecasts and simplified ship performance models to recommend a track and speed schedule that avoids the worst weather while keeping time and fuel in mind.
Step 3&4: Execution and monitoring–holding the plan and trimming around it
Once the plan is approved, it’s transferred to Electronic Chart Display and Information System (ECDIS) and/or paper charts. During the voyage, the bridge team:
Monitors conditions vs. forecast
Adjusts course and speed around heavy weather, traffic, or unexpected constraints
Sends noon reports and performance data back to shore
May get updated advice from a routing service when major systems move in
It’s a professional, structured process—but the intelligence sits mostly in people, not in the tools. The assumptions under the route are often:
Generic ship behavior: standard speed‑power tables and sea margin assumptions, not tuned to the specific hull’s fouling, loading, or age.
Coarse weather: global models at relatively low resolution, interpreted manually by crews or forecasters.
Static trade‑offs: a route chosen up front for “fastest” or “safest,” then only occasionally revisited when circumstances force the issue.
It works—but it leaves a lot of performance, comfort, and predictability on the table.
The limits of ship‑agnostic routing
From the helm, you feel those limits as:
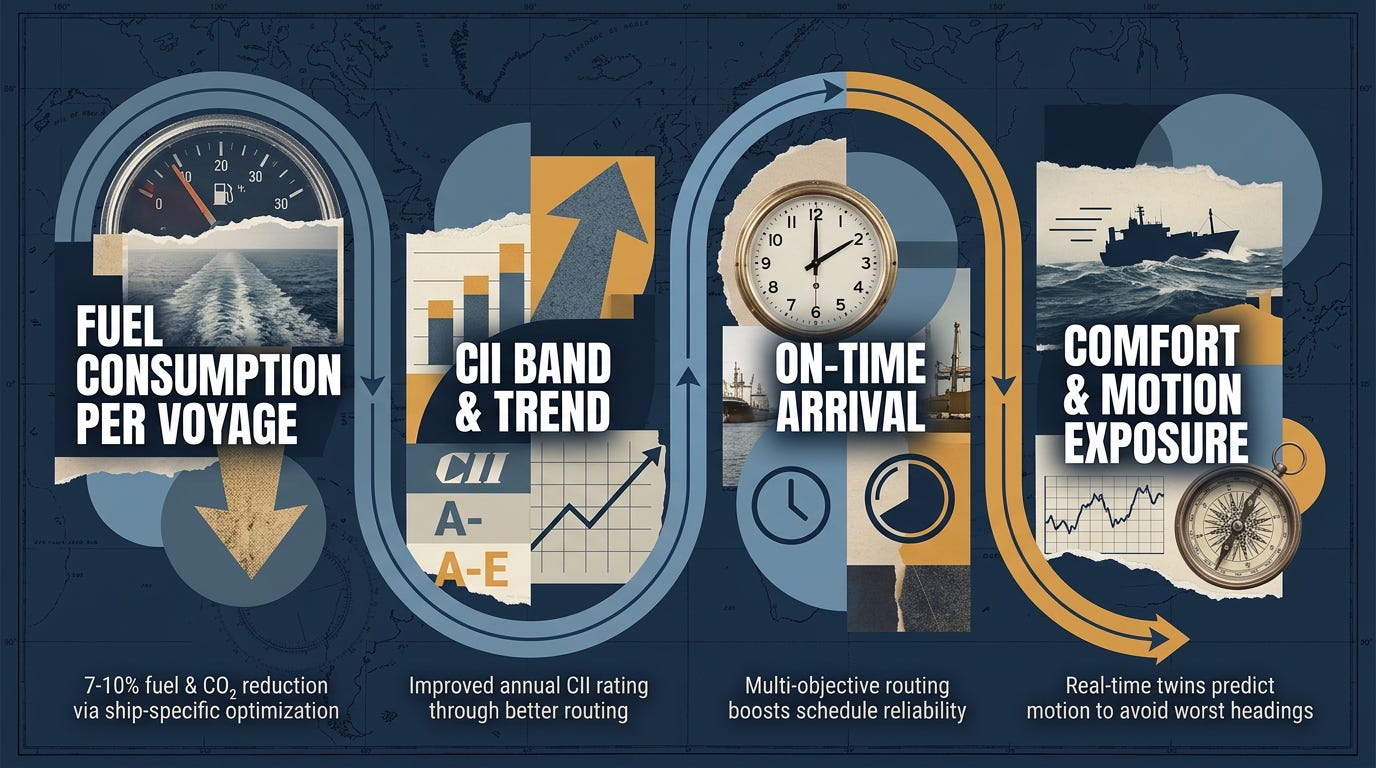
Fuel and emissions creep. A few percent extra fuel on each leg doesn’t show up like a grounding, but across a fleet it’s the difference between meeting carbon intensity indicator (CII) targets or not.
Weather surprises. Forecasts evolve. Ensemble models may radically adjust storm tracks a few days out, but your original plan was built on a single snapshot.
Vessel individuality. Two sister ships on the same line behave differently: one with a clean hull and tuned autopilot, the other with rougher bottom and different loading patterns. Traditional routing tends to treat them as identical.
In other words, most current routing is still ship‑agnostic and episodic. The plan may be updated, but it’s not constantly asking: “Given who this ship is today and what the ocean looks like today, is there a better route and speed profile?”
That question is exactly where digital twins come in.
What a vessel digital twin really is
“Digital twin” gets thrown around a lot, but in the maritime performance world it has a fairly concrete meaning.
At its core, a digital twin is a living, data‑driven model of a specific vessel’s behavior, continuously updated with real‑world measurements. It typically combines:
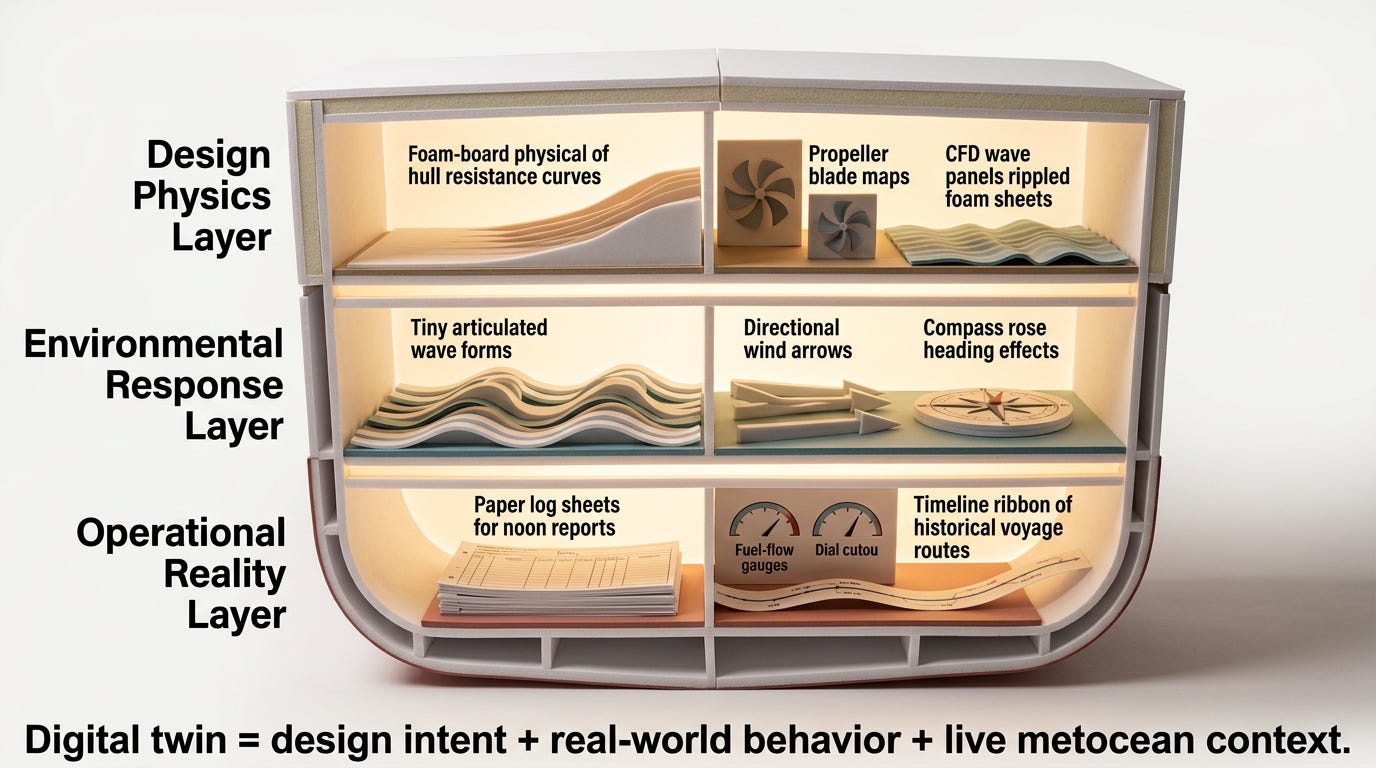
1. Design‑time physics
From the shipyard and naval architects you get:
Hull resistance and propulsion curves
Propeller characteristics and engine mappings
Seakeeping predictions: motions and accelerations in different sea states and headings
Stability and loading envelopes
These models are derived from computational fluid dynamic (CFD)2, tank tests, and design calculations, and they set the initial “personality” of the twin.
2. Environmental response
Next, the twin encodes how this hull responds to:
Different wave heights, periods, and directions
Winds from various angles and strengths
Currents and swell interacting with the ship’s course and speed
NOAA‑linked work on real‑time digital twins emphasizes predicting motions and loads in actual waves so crews can anticipate comfort and structural risk along candidate routes. For DP vessels and offshore units, research shows twins can be trained to forecast thruster loads and six‑degree‑of‑freedom motions under complex metocean3 forcing.
3. Operational “truth data”
Finally—and most importantly—the twin is tied to the ship’s real life:
Noon reports and daily performance logs
Engine, shaft, and fuel‑flow telemetry
Speed over ground, draft, trim, and sometimes motion sensors
Recorded voyages under varied loading and fouling conditions
NAPA describes this explicitly: they merge “big data” from voyage histories with design‑time models and port data to create a ship performance model that forms the vessel’s digital twin, continuously refined as more data comes in. Spire’s voyage‑optimization services, which can incorporate high‑fidelity digital‑twin technology from partners such as Syroco, follow a similar loop—using operational data to keep the virtual ship aligned with how the real hull is actually performing at sea. In pilot projects, Syroco has reported double‑digit improvements in energy efficiency by combining continuously calibrated digital twins with weather‑optimized routing, without extending voyage time.
When that loop is healthy—design physics plus measured behavior feeding back into the model—you end up with something powerful: a twin that knows how this hull, in this condition, actually moves and burns fuel in today’s seas. That’s the safe‑passage baseline for AI routing: a trustworthy link between the numbers on the screen and the real hydrodynamics under your keel.
The real work in making sure a digit twin is effective is all in the data: data cleaning, anomaly detection, and quality control. It is exactly this “messy middle” layer that underpins AI routing but rarely gets talked about in press releases. So, lets take a slight detour into the “messy middle” for a moment.
Life of a Data Point: From Ocean to Optimization
In traditional voyage planning, the data flow is simple and human‑centric: you gather charts, routing guides, and a few weather apps, plan a route, and then adjust manually based on what experience while underway. Once you step into the world of digital twins and AI routing, the data flow becomes much richer—and much easier to get wrong—because thousands of data points are now offering micro‑adjustments for you (of course, you will have the option to approve them – ‘human in the loop’ is required).
This is where the life of a data point matters. Every single piece of information—one wave‑height estimate, one shaft‑power reading, one current vector—passes through a pipeline before it ever influences the route. Understanding that pipeline is the key to trusting the line that shows up on the screen.
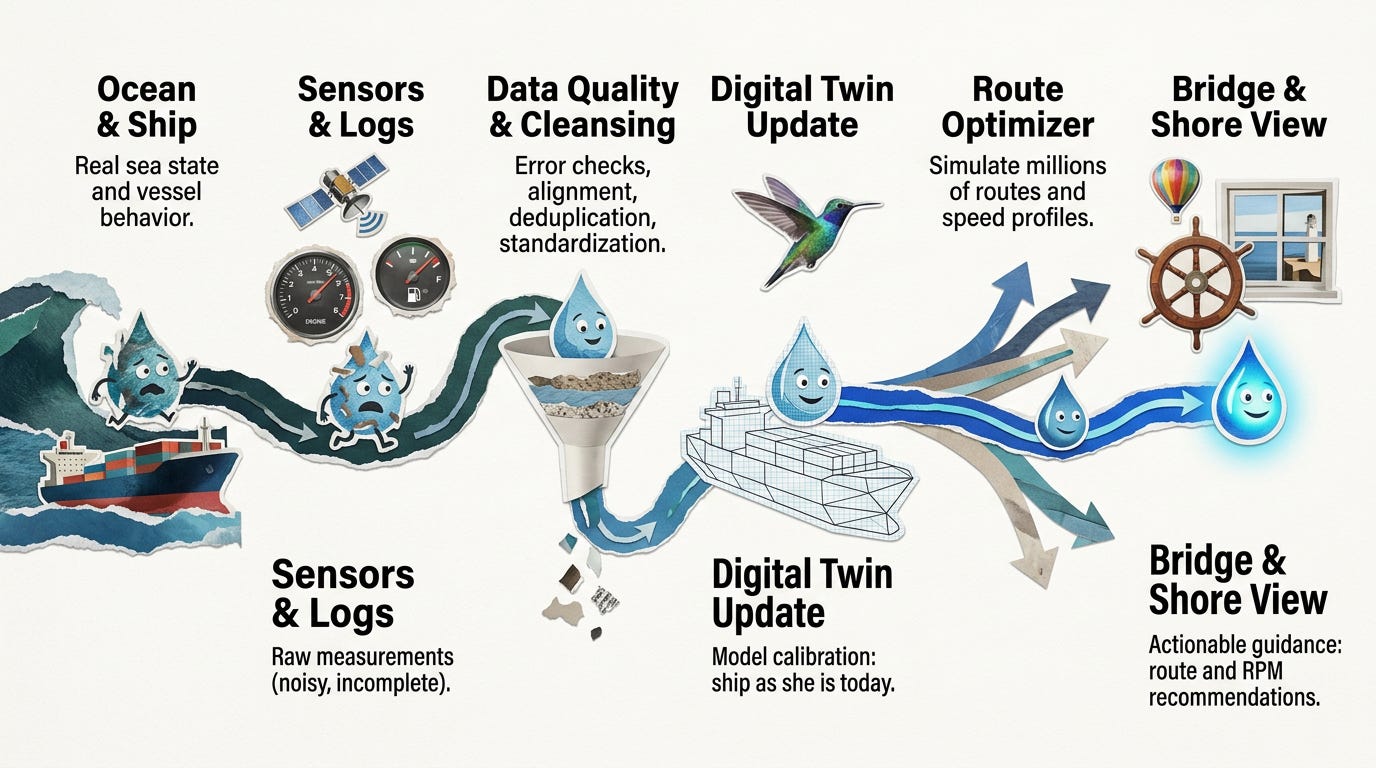
You can think of the journey like this:
1. Ocean and ship: the raw reality
Everything starts with the real world: waves hitting the hull, wind wrapping around the superstructure, engines turning, and the vessel responding in speed and motion. That physical interaction is what we ultimately care about—comfort, safety, fuel, and arrival time all live here.
2. Sensors and logs: reality becomes numbers
Sensors and systems try to capture that reality as data:
Position and speed from GPS and AIS (Automatic Identification System)
Wind from anemometers
Engine load, RPM (revolutions per minute), and fuel‑flow meters
Draft, trim, and sometimes motion sensors
Noon reports and manual entries
This is the first translation—from water and steel into numbers. It’s also where errors, gaps, and mis‑calibrations start creeping in (listen to my podcast episode with Tocaro Blue to learn more about how radar data is translated).
3. Data ingestion: assembling the puzzle
In a modern system, those numbers don’t live in one place. They arrive from:
Onboard systems and logs
Shoreside performance databases
External feeds like satellite‑driven metocean (meteorological and oceanographic) datasets for winds, waves, and currents
A data pipeline pulls all of this into a common environment. At this stage, it’s like dumping every logbook, weather fax, and instrument printout into one big box—useful, but not yet safe to base decisions on.
4. Data quality and cleansing: the “messy middle”
This is the critical middle step between traditional route planning and a trustworthy digital twin.
In data‑science terms, this is where you profile, clean, and standardize the data so the models are learning from reality instead of from noise. Specifically, teams:
Fix or flag missing values (e.g., a blank fuel‑flow reading).
Remove duplicates and obviously impossible readings (a vessel “jumping” 200 nautical miles in 5 minutes).
Align timestamps and time zones so wind, wave, and ship response data are actually talking about the same moment.
Standardize units and formats (knots vs. meters per second, metric vs. imperial).
Check for systematic bias—for example, a sensor that consistently reads low in certain conditions.
Why this matters: AI and digital twins are pattern‑matching engines – similar to how LLM models work. If you feed them inconsistent, misaligned, or biased data, they will faithfully learn—and then amplify—those errors. That’s how you end up with “smart” routing that underestimates fuel burn, misjudges motions, or optimizes for the wrong conditions altogether.
From a mariner’s perspective, this cleansing step is the data equivalent of keeping your logbook neat and your instruments calibrated. It’s unglamorous, but it’s the difference between a trustworthy record and one you side‑eye every time you make a decision.
5. Digital twin update: teaching the model who your ship really is
Once the data has been cleaned and aligned, it flows into the vessel’s digital twin. This is where the model learns:
How this hull actually slows down in head seas vs. quartering seas
How fuel consumption changes with small RPM changes under different loads
How fouling and maintenance are affecting performance over time
Over many voyages, the twin stops being a design‑office guess and becomes a live, evidence‑backed portrait of your ship’s behavior. Without that clean data feeding in, the twin never matures—it stays stuck in “trial condition” fantasy land.
6. Route optimization engine: turning behavior into better routes
Only after all of this does the routing engine start doing its work: simulating millions of possible route and speed combinations against live metocean fields, using the twin to predict time, fuel, motions, and Carbon Intensity Indicator (CII) performance for each option.
This is the point where traditional and AI‑assisted routing diverge most clearly:
Traditional routing jumps almost directly from “forecast and generic tables” to “chosen route.”
AI routing inserts a rigorous middle layer: data pipeline → digital twin → optimization, so the route is grounded in how your ship actually behaves in the ocean it is actually sailing through.
7. Bridge and shore: human judgment on top
Finally, that optimized guidance shows up where you live: on the helm and in the operations center. Masters, captains and operators see recommended tracks and RPM plans, plus clear trade‑offs between time, fuel, comfort, and compliance—and can accept, modify, or reject them based on seamanship, traffic, and real‑world constraints. Similar to how a human harbor pilot operates today. They make recommendations to the Captain who can choose to follow or not follow.
How AI routing uses the digital twin
Once the digital twin is in place and the data has been cleansed, route optimization stops being a one‑time line‑drawing exercise and becomes an ongoing computation.
Most modern systems follow a similar pattern:
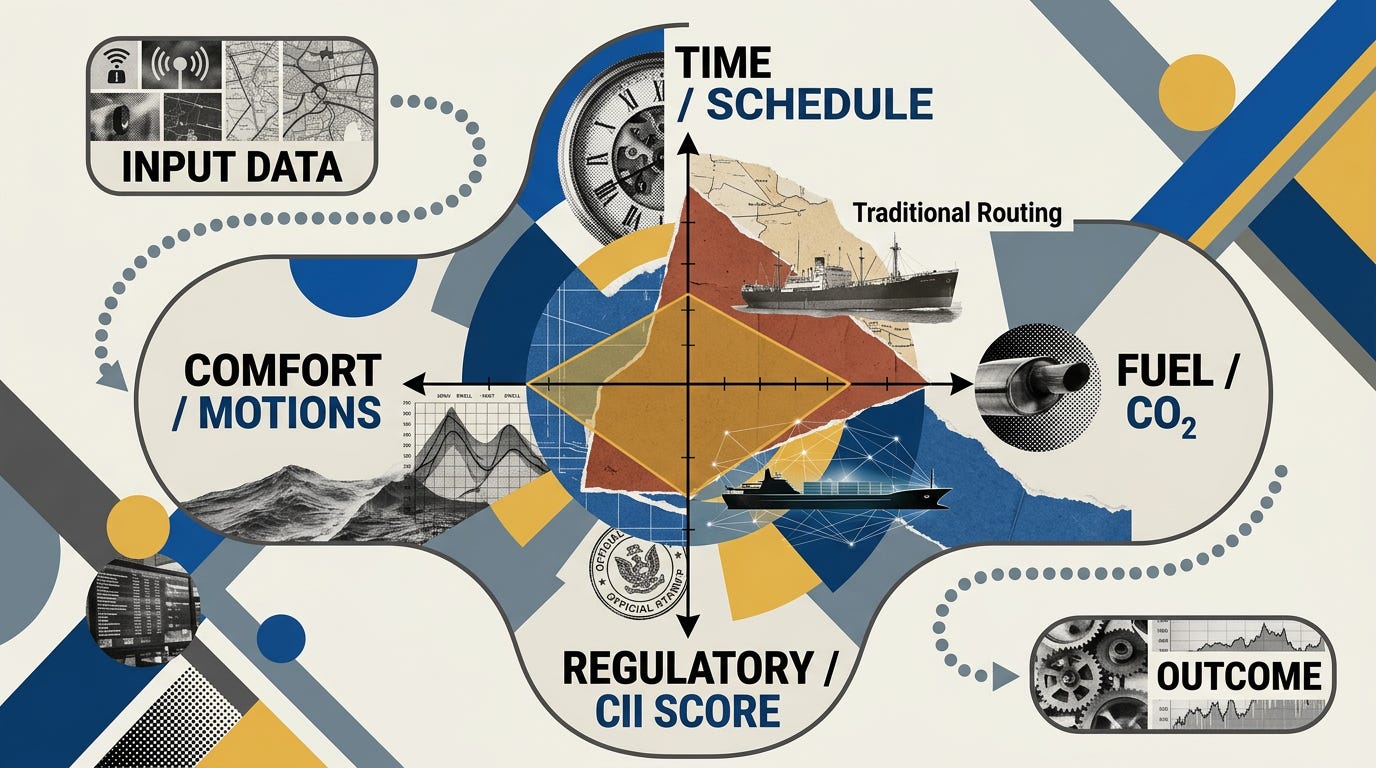
Step 1: Decide what “best” means
Operators set the objective:
Minimum time
Minimum fuel or CO₂
Best time‑charter equivalent (TCE)
Compliance with Carbon Intensity Indicator (CII4) or other environmental metrics
They also encode constraints: arrival window, maximum motion limits, no‑go zones (ice, piracy, protected areas), speed limits, and emission control area rules.
Step 2: Pull in high‑resolution ocean intelligence
Instead of coarse global models, these platforms ingest dense, frequently updated metocean fields:
Wind
Swell and wind waves
Surface currents
Sometimes mixed‑layer properties and other ocean parameters
Sofar Ocean’s Wayfinder, for example, builds on a global network of free‑floating buoys and satellite data to produce what it calls “the most accurate marine weather,” updated in near‑real time while Spire’s solutions leverage space‑based observations to feed high‑resolution weather and current fields into their routing engines.
Step 3: Let the twin “sail” millions of candidate routes
Here’s where the magic and the math happens (and you know I love math!). For each candidate route and speed profile, the optimizer asks the twin:
If we steer this track, at this RPM, in this evolving weather, what speed over ground will we actually make?
How much fuel will we burn?
What will motions and loads look like along the way?
Because the twin encodes vessel‑specific behavior, those answers are tailored to the actual ship—not to some generic curve. Whichever system you have, NAPA, Sofar (Wayfinder), or Spire, will routinely evaluate millions of route/speed combinations to find the ones that best satisfy the chosen objective under realistic forecasts.
Step 4: Deliver a route and RPM plan
Instead of a single static route, the captain and shore teams (if using one) receive:
One or more recommended routes
RPM or power profiles by leg, often with daily guidance (e.g., “Today: 68 RPM; tomorrow: 62 RPM as you enter a favorable current”)
Predicted arrival time, fuel consumption, and emissions for each option
Wayfinder advertises 4–9% verified fuel savings per voyage by providing this vessel‑specific RPM and routing guidance, while maintaining schedule. Spire cites similar multi‑objective optimizations that lower energy use without lengthening the trip. This seems like a huge benefit if you are a mega-yacht captain trying to optimize your owners’ fuel costs.
Step 5: Keep updating as reality unfolds
Crucially, this isn’t a one‑and‑done computation. As the voyage progresses:
The forecast evolves
The ship’s actual performance deviates slightly from predictions
Operational constraints change (port congestion, schedule tweaks)
The digital twin ingests new data, and the optimizer recomputes.
It’s like having a routing team and performance engineer running in the background every day of the voyage, tuned to your vessel.
This is where the “contract of trust” comes in. If the twin is well‑maintained—fed by clean, quality‑checked data—the guidance it offers is not a black box; it’s a transparent negotiation between your ship and the sea.
Side‑by‑side: life of a route with and without a digital twin
To make this concrete, let’s zoom out and compare two Atlantic crossings.
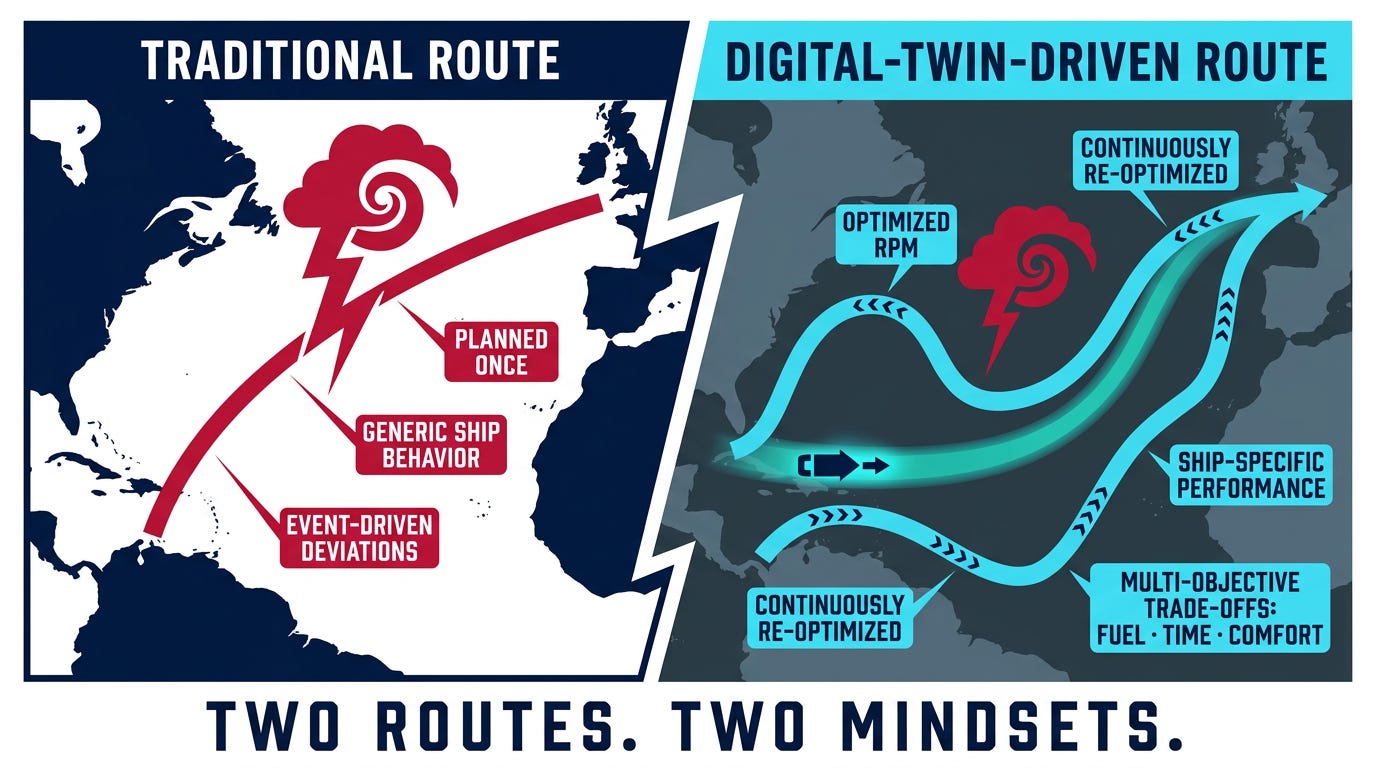
Scenario A: Traditional routing
You plan a great‑circle route with a diversion around a forecast mid‑ocean low.
The weather‑routing service recommends a couple of minor adjustments and a speed schedule based on generic performance tables.
On passage, the low deepens and shifts. You alter course based on updated advice, maybe give up a bit of fuel to maintain schedule, and ride out some rougher‐than‑expected seas.
Fuel ends up a few percent higher than planned; arrival is roughly on time; comfort was acceptable but not great.
Scenario B: Digital‑twin‑driven AI routing
Before sailing, your routing platform loads the latest metocean fields and spins up your vessel’s digital twin.
It explores millions of route and RPM combinations, looking not just at avoiding the core of the low but at how your hull will ride the resulting wave fields on each option.
It proposes a track that skirts the worst motions while catching favorable currents on later legs, with a tailored RPM plan to hit your ETA and minimize fuel.
Each day, as the forecast shifts and your actual performance is logged, the twin updates and the guidance adjusts: “Today, reduce RPM slightly—currents are stronger than expected; tomorrow, you can regain time in smoother seas without extra fuel.”
As the Captain, you still have veto power. Human judgment and COLREGs never leave the bridge. But the underlying analysis is no longer constrained by generic curves and static assumptions.
From your helm’s perspective, the difference is subtle but profound:
The line on the chart is no longer a guess; it’s a continuously negotiated truce between physics, weather, and your commercial reality.
Why this matters at the tactical helm
Even if you’re not running a 300‑meter bulker, this shift is worth paying attention to.
At the tactical helm level, here’s what vessel‑specific routing unlocks over time:
More predictable fuel and arrival windows. When route and speed guidance reflect how your boat actually performs in chop, you can plan fuel and schedules with more confidence—whether you’re crossing an ocean or optimizing your charter fleet operations.
Higher “comfort per mile.” Digital‑twin‑aware routing can prioritize not just survival, but minimizing long exposures to headings and periods that induce the worst motions for your hull.
Better use of your attention. Integrated tools like LR OneOcean’s route optimization modules bring weather, hazards, and constraints into a single picture, reducing manual plotting work so you can focus on lookout and decision‑making.
Zooming out to the safety objective for every crossing and extended voyage, this is exactly the future of passage making that should make us optimistic: massive satellite‑driven metocean datasets and high‑end vessel models distilled into route options and RPM numbers that can be managed by a Captain at the helm.
And for the contract of trust? That’s really what digital twins are about. They’re a promise—backed by physics, data, and continuous validation—that when your screen tells you, “If you steer this way at this speed, you’ll arrive at this time burning this much fuel in this sea state,” it’s not pretending to know every uncertainty, but it is telling the truth it has earned based on your vessel’s data.
This is a very simplified version of what a professional shipping captain does for voyage planning. The intension is to describe it at the 10,000’ level and paint the picture of ‘what is possible’ when using a digital twin. I am not a professional shipping captain and make no claims that this is 100% accurate based on the actual day-to-day requirements of the job. If you are a professional shipping captain and have read this far, please reach out to me! I would love to have your input.
CFD (Computational Fluid Dynamics) is a branch of fluid mechanics that uses numerical methods and computer simulations to solve the equations governing fluid flow and predict how liquids and gases move around objects.
In naval architecture and ship design, it is used to:
Model how water flows around a specific hull form and appendages.
Predict resistance, wave patterns, sinkage, trim, and seakeeping behavior in different sea states.
Optimize hull shapes and configurations digitally before building or tank‑testing, improving performance and reducing fuel consumption.
Metocean data (meteorological + oceanographic data) is the combined picture of weather and sea state: wind, waves, currents, tides, water temperature, etc.
For routing and digital twins, the key metocean variables are things like:
Wind speed and direction
Wave height, period, and direction
Surface currents
Sometimes sea level, temperature, salinity, and more
CII (Carbon Intensity Indicator) – The International Maritime Organization’s operational efficiency metric that measures a ship’s annual carbon intensity (CO₂ emissions per unit of transport work) and assigns an A–E rating based on how it performs against required benchmarks.